Can Active Fund Managers Consistently Outperform the Market? (Part Two)
In the first part of this blog series, we examined the fundamental reasons why it is so difficult for active fund managers to consistently outperform a given index. But some proponents of active management may point to standout funds, such as the Baillie Gifford American fund, as evidence to the contrary.
Indeed, over the past decade, the fund delivered a return of 353.6%, significantly outperforming the S&P 500’s return of 327.8% over the same period (Morningstar 2024). However, on closer inspection, this merely highlights an important point discussed in part one: the challenge of achieving risk-adjusted outperformance.
The fact is, Baillie Gifford’s team made concentrated bets, allocating over half of its portfolio to technology and communication stocks (Morningstar 2025). This meant the fund offered significantly less diversification than the S&P 500. Consequently, the 10-year Sharpe ratio—a key measure of risk-adjusted return—was substantially lower: 0.48 for Baillie Gifford American vs 0.74 for the S&P 500 (Morningstar 2024).
Furthermore, in 2022, the fund experienced a catastrophic drawdown of 51.06%, compared to 21.52% for the S&P 500 (Morningstar 2024). If the fund’s managers were genuinely skilled, one might reasonably ask: why such extreme underperformance in that year?

Figure 1. Baillie Gifford American Fund Annual Returns vs. Benchmark (2015–2024)
So, are there any truly skilled fund managers?
Yes—but they are extremely rare.
The Exceptional Few
There are some notable exceptions. Renaissance Technologies’ Medallion Fund is the gold standard for consistent outperformance. Likewise, Warren Buffett and Berkshire Hathaway have delivered phenomenal returns over many decades.
However, even Buffett—the ‘Oracle of Omaha’—underperformed the S&P 500 from 2010 to 2023 (Morningstar 2023). Additionally, research by Cliff Asness and colleagues at AQR shows that much of Buffett’s long-term returns can be explained by exposure to common risk factors like value, quality, and low volatility (Frazzini, Kabiller, and Pedersen 2018). These risk premia can often be captured more efficiently through low-cost factor ETFs.
As for secretive Renaissance, their Medallion Fund is closed to new investors, meaning its performance is irrelevant to most of us.
The Berk and Green Insight
Even if a skilled manager exists, there is a further challenge: access. According to the Berk and Green model (2004), skilled managers attract capital quickly. However, as more money flows into their funds, opportunities for outperformance shrink. This dynamic makes it nearly impossible for the average investor to benefit from a manager’s alpha over time.
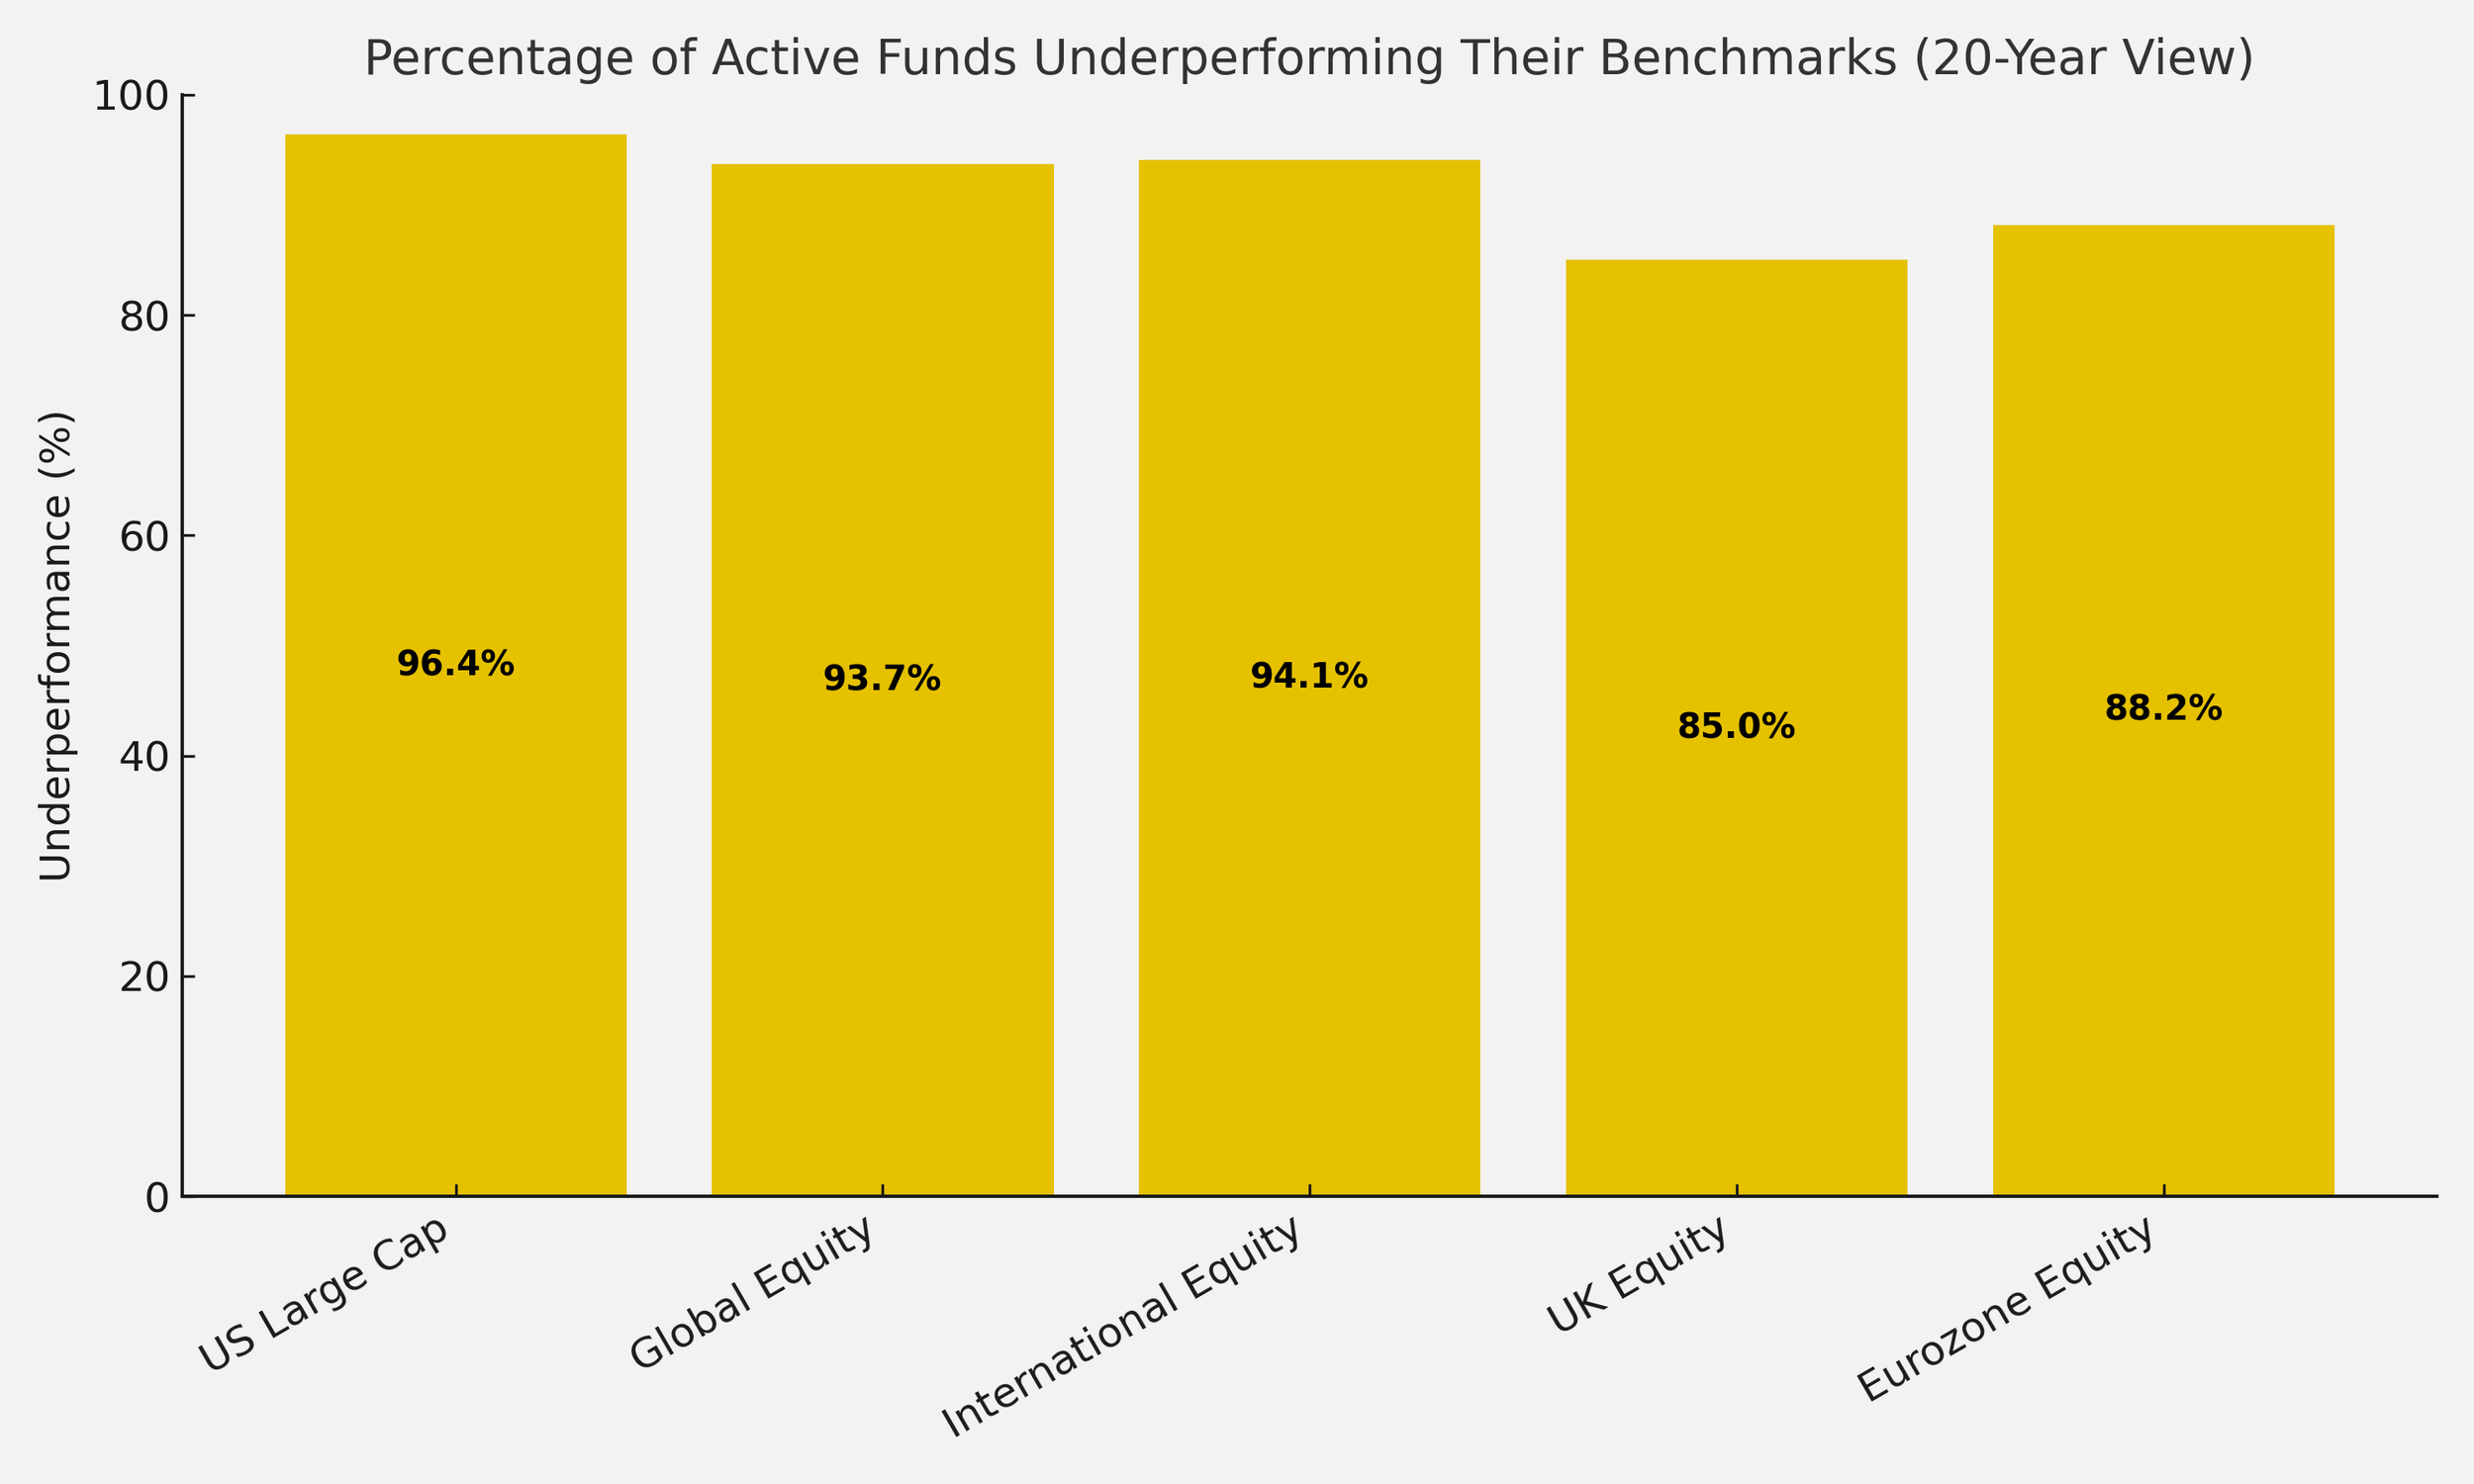
Figure 2. Percentage of actively managed funds underperforming their benchmarks over a 20-year period across key regions. Data from SPIVA Year-End 2023 Scorecards.
What About Market Efficiency?
To maintain intellectual honesty, it is worth revisiting the Efficient Market Hypothesis (EMH) and its critics.
EMH suggests that all available information is already priced into markets. This would imply:
No investor can consistently outperform the market.
There’s no incentive to gather or analyse information.
This leads to the Grossman–Stiglitz paradox (1980). If markets were perfectly efficient, no one would gather information. But without informed investors, markets couldn’t be efficient. Therefore, some inefficiency must exist to reward those who do the hard work of information gathering.
It follows that a small proportion of active managers must exist to keep prices accurate—thus maintaining the environment in which passive investing works.
Fama and French: The 3% Insight
Fama, the Nobel laureate who developed EMH, along with Kenneth French, analysed mutual fund data and found that only about 3% of active funds demonstrated true skill after fees (Fama and French 2010; French 2012). This implies that 97% of active managers do not outperform passive benchmarks on a net basis.
This aligns closely with findings from the SPIVA U.S. Scorecard, which shows that 96.39% of U.S. large-cap fund managers underperformed their benchmarks over 20 years (S&P Dow Jones Indices 2024a). The trend is similar globally: 93.65% of global fund managers and 94.08% of international fund managers underperformed (S&P Dow Jones Indices 2024b).
In other words, the market needs a small fraction—around 3%—of active participants to maintain price efficiency. For the rest of us, passive investing remains the most rational choice.
Final Thoughts
There is little doubt that some skilled fund managers exist. But for most investors:
The odds of identifying one in advance,
Gaining access to their fund before it closes,
And benefiting from their outperformance after fees and taxes—are exceedingly low.
When the evidence is this overwhelming, the most effective course of action is clear: invest passively, diversify broadly, and keep costs low.
References
Berk, Jonathan B., and Richard C. Green. 2004. “Mutual Fund Flows and Performance in Rational Markets.” Journal of Political Economy 112 (6): 1269–1295. https://doi.org/10.1086/424739.
Fama, Eugene F., and Kenneth R. French. 2010. “Luck versus Skill in the Cross-Section of Mutual Fund Returns.” Journal of Finance 65 (5): 1915–1947. https://doi.org/10.1111/j.1540-6261.2010.01598.x.
Frazzini, Andrea, David Kabiller, and Lasse Heje Pedersen. 2018. “Buffett’s Alpha.” Financial Analysts Journal 74 (4): 35–55. https://doi.org/10.2469/faj.v74.n4.3.
French, Kenneth R. 2012. “The Cost of Active Investing.” Journal of Finance 63 (4): 1537–1573.
Grossman, Sanford J., and Joseph E. Stiglitz. 1980. “On the Impossibility of Informationally Efficient Markets.” American Economic Review 70 (3): 393–408.
Morningstar. 2023. “Berkshire Hathaway vs S&P 500: Performance Comparison.” Accessed April 14, 2025. https://www.morningstar.com.
Morningstar. 2024. “Baillie Gifford American Fund: Performance Table (2015–2024).” Accessed April 15, 2025. https://www.morningstar.co.uk.
Morningstar. 2025. “Baillie Gifford American Fund B Accumulation.” Accessed April 15, 2025. https://www.morningstar.co.uk/uk/funds/snapshot/snapshot.aspx?id=F0GBR0506U.
S&P Dow Jones Indices. 2024a. SPIVA U.S. Year-End 2023: Active Funds vs. Their Benchmarks. New York: S&P Global. Accessed April 15, 2025. https://www.spglobal.com/spdji/en/research-insights/spiva/.
S&P Dow Jones Indices. 2024b. SPIVA International Year-End 2023: Active Funds vs. Their Benchmarks. New York: S&P Global. Accessed April 15, 2025. https://www.spglobal.com/spdji/en/research-insights/spiva/.
S&P Dow Jones Indices. 2024c. SPIVA Scorecards: Long-Term Active Fund Underperformance by Region. New York: S&P Global. Accessed April 15, 2025. https://www.spglobal.com/spdji/en/research-insights/spiva/